The Ultimate Guide to Understanding Your Sleep Study Report
A board-certified sleep doctor helps you to understand what's inside your sleep study results and what it means for you.

Dr. Jagdeep Bijwadia, M.D.

Ever wonder what all the components of a sleep report actually mean? You’ve come to the right place.
When you undergo an at-home sleep study, the resulting report offers a treasure trove of insights into your sleep health, including whether you're grappling with obstructive sleep apnea along with a slew of important and fascinating details. For example, did you know that we can tell based solely on your sleep report whether you sleep on your back, your side, or your stomach? It's truly fascinating how much this document can tell your physician about your sleep habits and health.
Let’s take a survey of the most important takeaways from your home sleep test report, then dive into the specifics of what you’ll see with that report in hand.
Summary and Diagnosis: The Most Important Section of a Sleep Report
Sleep reports contain a lot of information, but if you want straightforward answers, focus on the “Summary and Diagnosis” section. That’s where you’ll learn:
Whether or not you have sleep apnea: this is determined by the Apnea-Hypopnea Index (AHI) - if it’s less than 5, you don’t. If it’s over 5, you do.
How bad your sleep apnea is: your AHI score also tells us what category of severity you fall into: mild (5-15), moderate (15-30), or severe (30 and above).
Recommendations for therapy: the sleep physician interpreting the study suggests CPAP, oral appliances, etc based solely on the data they see in the study. This is helpful, but may be of limited usefulness since they don’t know you as a patient.
If you're keen on deciphering the intricacies of your sleep study data, read on as we break down your report from top to bottom.
When You'll Receive Your Sleep Study Report
First, let's talk about when in your sleep apnea journey the home sleep test and report come into play. Typically, the process starts when a patient or their partner is concerned about symptoms like snoring, daytime tiredness, weight gain, morning headaches, and more.
After doing some research online and finding out sleep apnea may be the culprit for how they feel, patients will typically:
1. Take a screening questionnaire to find out if they’re at risk based on their symptoms.
2. Purchase a home sleep study and use it for the instructed number of nights.
3. Receive a sleep report once results have been electronically received and interpreted by a board-certified sleep physician. This varies, but can happen as quickly as 1-2 days after you used your home sleep study kit.
The Components of a Sleep Study Report
While not all sleep studies are identical, they typically follow a similar, predictable structure.
Section 1. Patient/Study/Physician Information
This section confirms vital details such as your identity, the ordering physician, and relevant dates. Key points to note include:
Ensuring accuracy in personal information to avoid administrative errors.
Verifying relevant physician and insurance information.
Highlighting factors like BMI, crucial for assessing sleep apnea risk.
Section 2. Summary and Diagnosis
This section, usually near the report's beginning, offers free-hand insights from the interpreting physician about the contents of your report. Keep in mind, the physician who interprets your report won't necessarily be the same person who meets with you and recommends treatment—so it's a good idea to read and understand this section for yourself. That way, you can confidently discuss options with the medical provider who prescribes your treatment. Here are the details contained in this section:
Adequacy of the Sleep Study
Here, the interpreting physician will note whether your home sleep test collected sufficient information to reach the needed conclusions about your health. Those technical criteria include:
Whether the home sleep test recorded a long enough period of sleep
The quality of the data coming from the sensors
Whether you spent enough time in certain sleep cycles
While this section may seem technical, your medical provider will guide you through any necessary follow-up actions.
The Technology Used in the Study
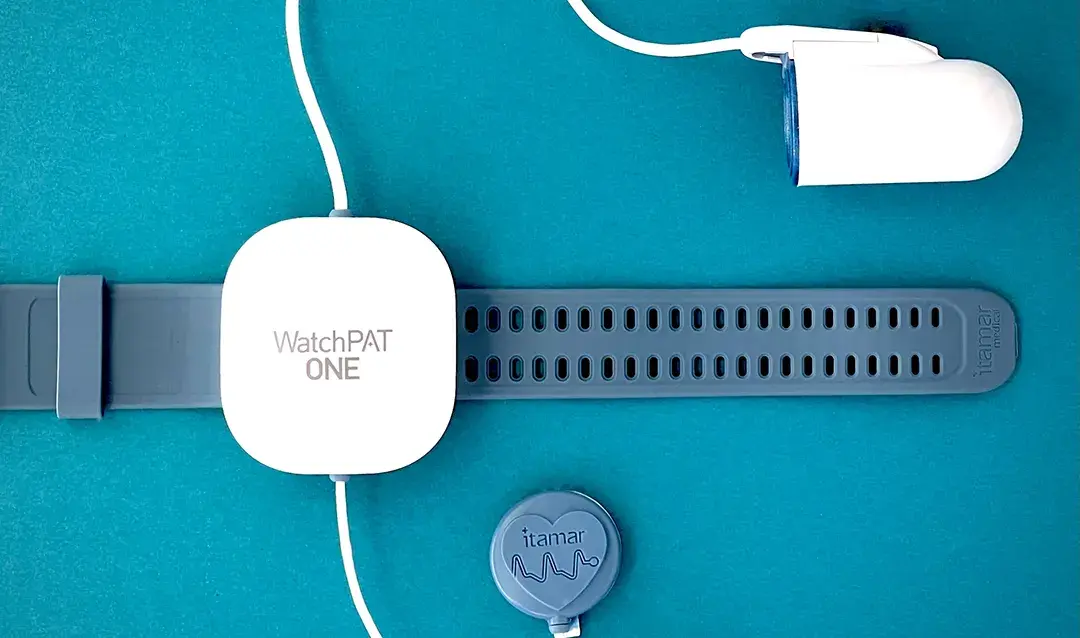
During an at-home sleep study, you wear a finger-clip, wrist strap, and possibly a chest sensor. Your sleep report might mention what specific sensors they used to gather data, such as:
Oximetry sensors that measure your oxygen levels (this drops when you experience an episode of sleep apnea).
Pulse rate sensors detect spikes in your pulse, which happen after your body triggers a “fight or flight” response to make you start breathing again.
Peripheral arterial tonometry sensors also indicate if your body is experiencing an acute “stress” response by measuring elevations in arterial tone, which is a type of measurement that’s not too dissimilar from blood pressure.
Body position sensors will tell us what types of positions you experience apneas in, which can be helpful in guiding recommendations for treatment.
Breathing movement and effort sensors tell us if your body is putting more effort into breathing, which often happens in response to an episode of sleep apnea.
Altogether, the data collected helps your board-certified sleep physician measure the frequency of two events:
Apneas. When sensors detect both a drop in oxygen of at least 3 or 4% and the triggering of your fight or flight response, that counts as one “apnea”.
Hypopneas. Think of these as partial apneas. They happen when your breathing doesn't fully stop, but it becomes shallow enough to cause a drop in your blood oxygen.
Your AHI and Diagnosis
Your diagnosis of obstructive sleep apnea (OSA) hinges on your AHI. This number tells us how many times you experienced an apnea or hypopnea every hour. If that number is less than 5, you don’t meet criteria for a diagnosis of obstructive sleep apnea. Alternatively, if the number is greater than 5, these are the categories of severity:
Mild OSA: AHI of 5 to 15
Moderate OSA: AHI of 15 to 30
Severe OSA: AHI greater than 30
The severity of your sleep apnea matters because it helps us understand how at-risk you are for developing bad health outcomes (like diabetes, heart disease, and stroke) and also to help us guide treatment decisions.
The Doctor’s Therapy Recommendations
Based on the severity of your sleep apnea, the sleep physician who interpreted your study will offer recommendations on therapy, including CPAP, oral appliances, or surgery.
Bear in mind that, even if they write that CPAP therapy is the “gold standard” or “first line” for treating sleep apnea, this doesn’t always take your unique situation into consideration. A decision about your choice of therapy is best determined through a conversation with your provider, factoring in your lifestyle, sleep habits, and the treatment plan you'll be able to commit to longterm.
Related: What Options Exist for Treating Sleep Apnea?
Additional Lifestyle Recommendations
The interpreting physician may also offer additional lifestyle tips on improving sleep quality, like reducing alcohol usage (which negatively affects sleep cycles), losing weight (which may improve the severity of your sleep apnea), and encouraging exercise. While these won’t cure your sleep apnea, they may improve your sleep overall.
Learn more: Does Sleep Hygiene Help With Sleep Apnea?
Section 3. Technical Sleep Measurements
Following the free-hand text of the interpreting physician’s note, you’ll continue on to see the hard data they used to come to certain conclusions.
Sleep Time
Here, you’ll see how many hours of sleep were captured by the device. From a technical perspective, we only need around 4 hours of sleep to diagnose obstructive sleep apnea, so don’t be concerned if a whole 8 hours weren’t captured, or if you had a short night of sleep. It also includes how much of your sleep time was in REM cycles, but I’ll cover sleep cycles more broadly below.
Respiratory Indices
Sleep apnea is diagnosed based on AHI (or pAHI), but there are other illnesses we may diagnose under the umbrella of “Sleep Disordered Breathing.”1 These conditions are detected using different measurements, or “Indices”:
Respiratory Disturbance Index (RDI or pRDI): This number typically exceeds the AHI because it encompasses not only apneas and hypopneas but also 'Respiratory Effort Related Arousals' (RERAs). RERAs are similar to apneas and hypopneas, but don’t drop your oxygen levels below 3-4%. If your AHI is low but your RDI is high, you may be diagnosed with a condition called “Upper Airway Resistance Syndrome” (UARS),2 which is considered a less-severe condition than sleep apnea, but one that may still benefit from treatment based on your physician’s recommendation.
Oxygen Desaturation Index (ODI): Remember, apneas are counted when oxygen drops and a fight or flight response is registered at the same time. In contrast, the ODI just measures every time your oxygen drops past 3-4%. If you have a low number of apneas, but a higher ODI, it may indicate that you have other conditions causing you to drop oxygen levels while you sleep - examples include heart or lung diseases like heart failure or COPD.
Central Apnea Hypopnea Index (AHIc): There are actually two kinds of sleep apnea - central (CSA) and obstructive (OSA). They’re similar in that they cause you to stop breathing, but, in CSA, it’s because your brain doesn’t send your breathing muscles the signal to breath.3 There’s only one test on the market that detects “central” apneas, and it works by detecting whether or not there’s respiratory effort, alongside oxygen drops and stress response. In most cases, we don’t need the AHIc because CSA is only found in a very small portion of the population.
Learn more: Central Sleep Apnea vs Obstructive Sleep Apnea: What's the Difference?
Respiratory Disturbance Distribution
When we evaluate breathing-related sleep disturbances, we care about what sleep cycle they occur in, specifically Rapid Eye Movement (REM) and Non-Rapid Eye Movement (NREM) sleep stages. We also want to know what body position they occurred in, whether supine (lying face up), prone (lying face down), or side-sleeping. The reason these are important is because when you start some form of therapy later on, we want to specifically target the therapy to see improvements in cycles and positions your numbers were worst in.
Oxygen Saturation Statistics
While the AHI tells us how often your oxygen dips below 3-4%, it doesn’t give us information on exactly how low it’s getting or for how long. Instead, a comprehensive table provides that data broken down in various ways, including average oxygenation, how much of your sleep time you spent with low oxygen, and other variables.
Assuming you don’t have any medical conditions, your oxygen is normally supposed to be above 96-97%, so if you’re spending a lot of time below that number, this often contributes to all the terrible health outcomes we see in sleep apnea, like high blood pressure, heart disease, stroke, mental health issues, morning headaches, and more.
Pulse Rate Statistics
When your body triggers a fight-or-flight response for you to start breathing again, this causes your heart rate to increase. A normal pulse rate is 60-100 beats per minute, so being over that when your rate is naturally supposed to be lower due to sleep is once again associated with poor health outcomes.
Snoring Statistics
Some sleep studies use a microphone to record how often your snoring reaches above a certain decibel level. If your snoring is very loud and disruptive, this can actually cause awakenings and interrupted sleep on its own, even if it’s not causing your oxygen to drop.
Learn more: Snoring and Sleep Apnea: How Are They Related?
Section 4. Waveforms
No you’re not looking at the markings of a lie detector—waveforms take up a big portion of the sleep study report. It takes a lot of training to interpret these, but the basics are that you shouldn’t be seeing significant variations and spikes in measurements like pulse rate and oxygenation.
Section 5. Pie Charts
You may find pie charts which give a visual representation of how much time you spent in various sleep stages, how long it takes you to fall asleep (“latency”) and how many times you woke up throughout the night.
Technically, there are five stages of sleep: NREM 1-4 and REM. However, most sleep studies will divide those into 'deep, light, and REM' for simpler visualization.
NREM typically accounts for 80% of sleep time (which includes “light” and “deep” stages), and REM for the remaining 20%.4 Home sleep studies aren’t used to diagnose anything other than sleep apnea, but if your interpreting physician sees something obviously wrong with your sleep stages, they may refer you for a more formal, overnight sleep study.
Why You Should Care About Understanding Your Sleep Report
The most successful patients I see are those who take control of their own health situation and strive to understand diagnostic data, such as what is found in a sleep report.
Empower yourself with understanding, and then use that to make solid judgments about your sleep apnea treatment.
Memon J, Manganaro SN. Obstructive Sleep-Disordered Breathing. [Updated 2023 Aug 8]. In: StatPearls [Internet]. Treasure Island (FL): StatPearls Publishing; 2024 Jan-. Available from: https://www.ncbi.nlm.nih.gov/books/NBK441909/
Maggard MD, Sankari A, Cascella M. Upper Airway Resistance Syndrome. [Updated 2023 Jun 11]. In: StatPearls [Internet]. Treasure Island (FL): StatPearls Publishing; 2024 Jan-. Available from: https://www.ncbi.nlm.nih.gov/books/NBK564402/
Rana AM, Sankari A. Central Sleep Apnea. [Updated 2023 Jun 11]. In: StatPearls [Internet]. Treasure Island (FL): StatPearls Publishing; 2024 Jan-. Available from: https://www.ncbi.nlm.nih.gov/books/NBK578199/
Institute of Medicine (US) Committee on Sleep Medicine and Research; Colten HR, Altevogt BM, editors. Sleep Disorders and Sleep Deprivation: An Unmet Public Health Problem. Washington (DC): National Academies Press (US); 2006. 2, Sleep Physiology. Available from: https://www.ncbi.nlm.nih.gov/books/NBK19956/